
Eneryield IntelliView®
The fault-prediction platform for power networks
Eneryield IntelliView® reads disturbance recordings from your existing substation infrastructure and turns them into ranked, explained fault warnings — weeks before faults become outages — for transmission, distribution and industrial grids.
Measured results on customer networks
15 days
average warning
before the fault develops into an outage
100+
outages predicted in advance
across customer deployments
1M+
recordings analyzed
since the product launched
3 weeks
longest warning horizon
documented in live operation
In service with utilities and industry
20+ deployments, pilots and evaluations with transmission and distribution operators and industrial networks across Europe, North America, the Middle East and Asia — delivered directly and with our digitalization partners.
The product
One place to see the whole fleet
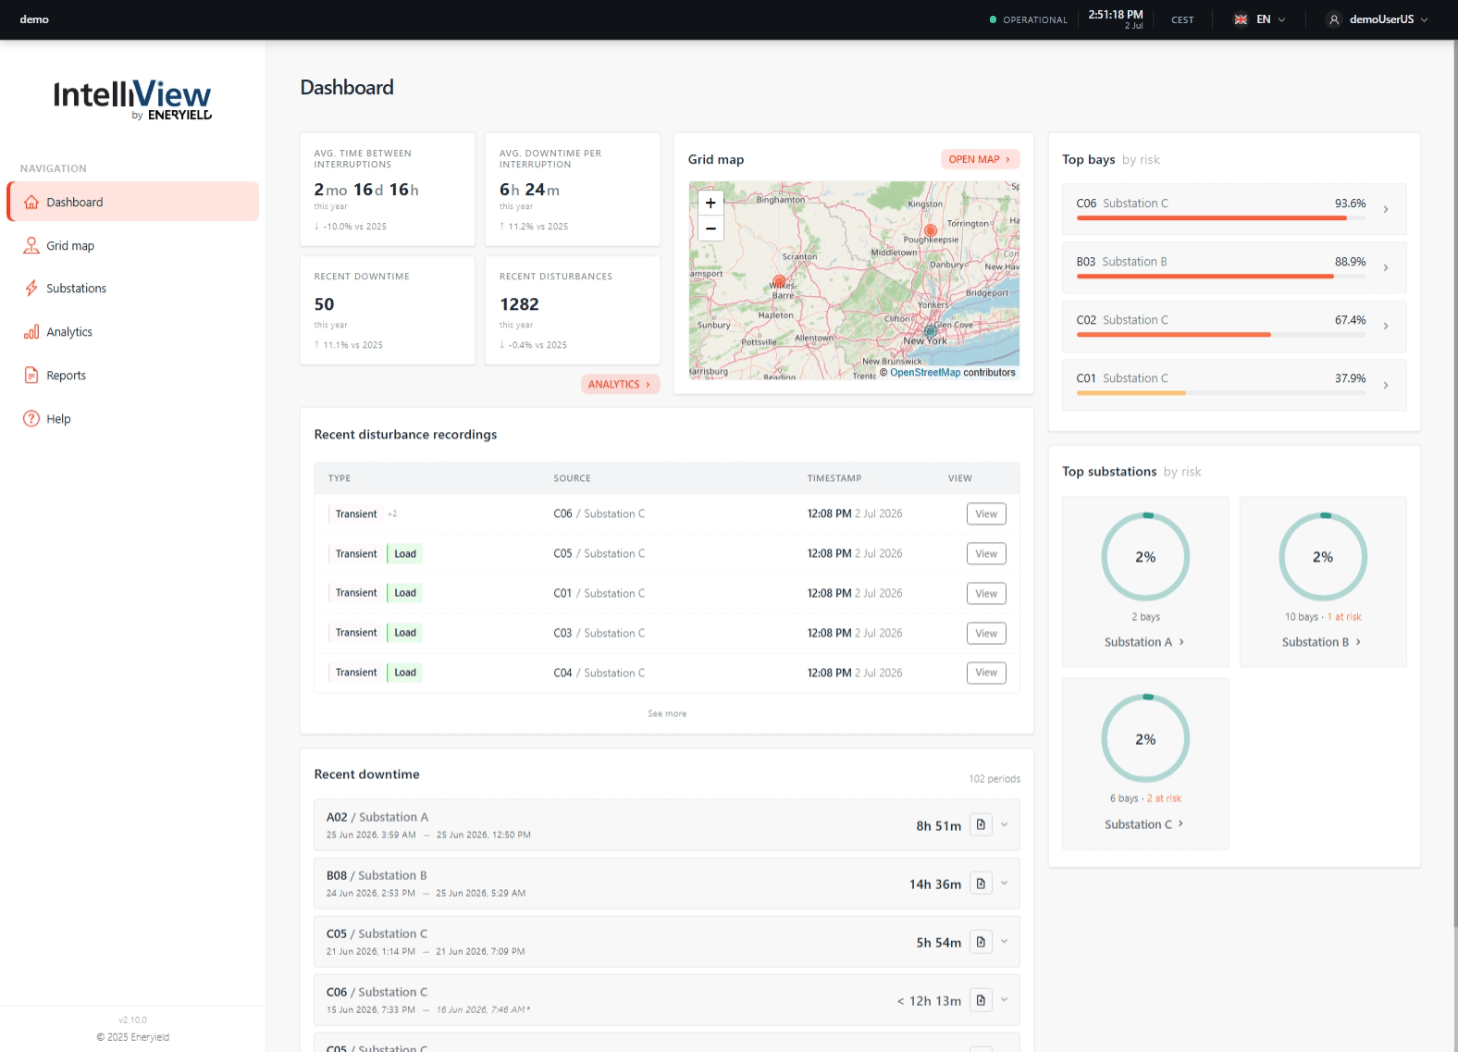
Fleet dashboard
Highest-risk bays and substations, recent disturbances and interruptions, the grid map and single-line diagram — the whole estate on one screen.
Substation & bay views
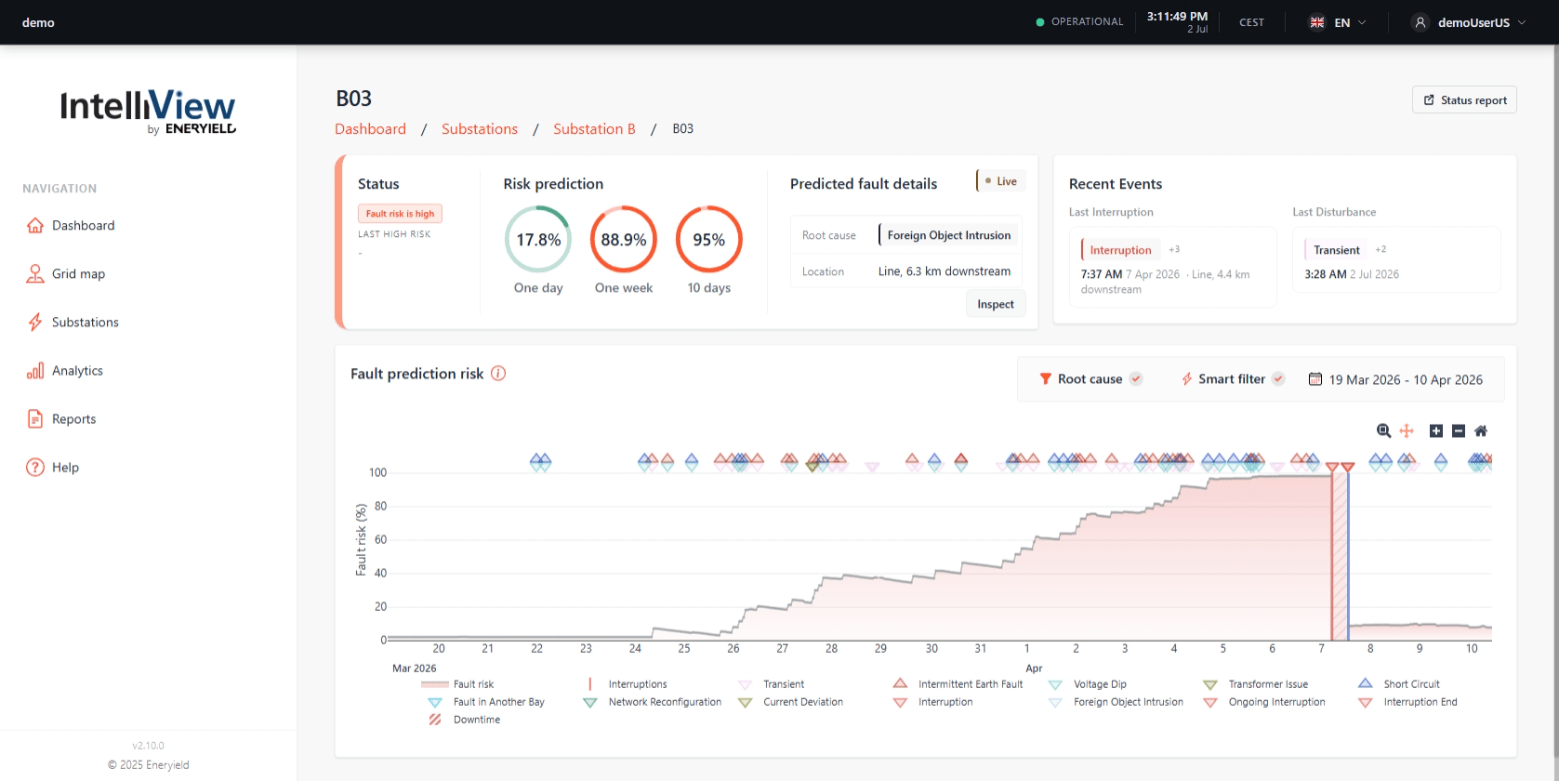
Every bay ranked by risk, with the single-line diagram and interruption history — then drill into any bay's fault-risk timeline and click a risk value to see exactly what drove it.
Recording inspector
Waveforms with RMS traces, harmonic spectrum (FFT) and impedance — events segmented, labelled and quantified, so engineers can verify the evidence themselves.
Reports & alarms
Status, interruption and analytics reports — scheduled or on demand — plus threshold alarms delivered to your inbox. No one has to watch a screen.
Fits your workflow
Risk and alarms over a REST API — feed your SCADA/ADMS, historian or work-order system.
Works on every grid type
Overhead lines, underground cables and submarine cables — transmission, distribution and industrial grids, from 13.8 kV bays to transmission cable, reactor and transformer banks.
How it works
From waveform to warning
- 1
Ingest & screen
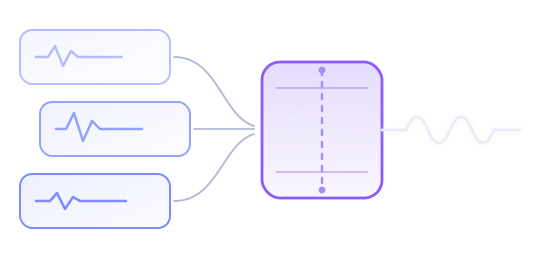
Disturbance recordings stream in from your substations. Each one is checked for measurement faults and classified by disturbance type — compromised data is flagged, never silently trusted.
- 2
Extract & predict
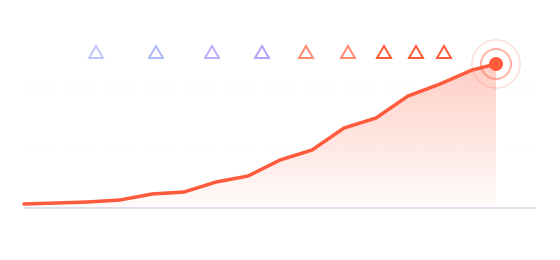
400 expert-designed features are distilled from every waveform. Physics-informed AI estimates rolling fault risk per bay — grounded in electrical reality, not curve-fitting.
- 3
Explain & alert
Every risk value traces back to the recordings behind it, with predicted cause and likely source. Alarms reach the people who can act — no one has to watch a screen.
Why explainability matters
Your engineers can check the reasoning
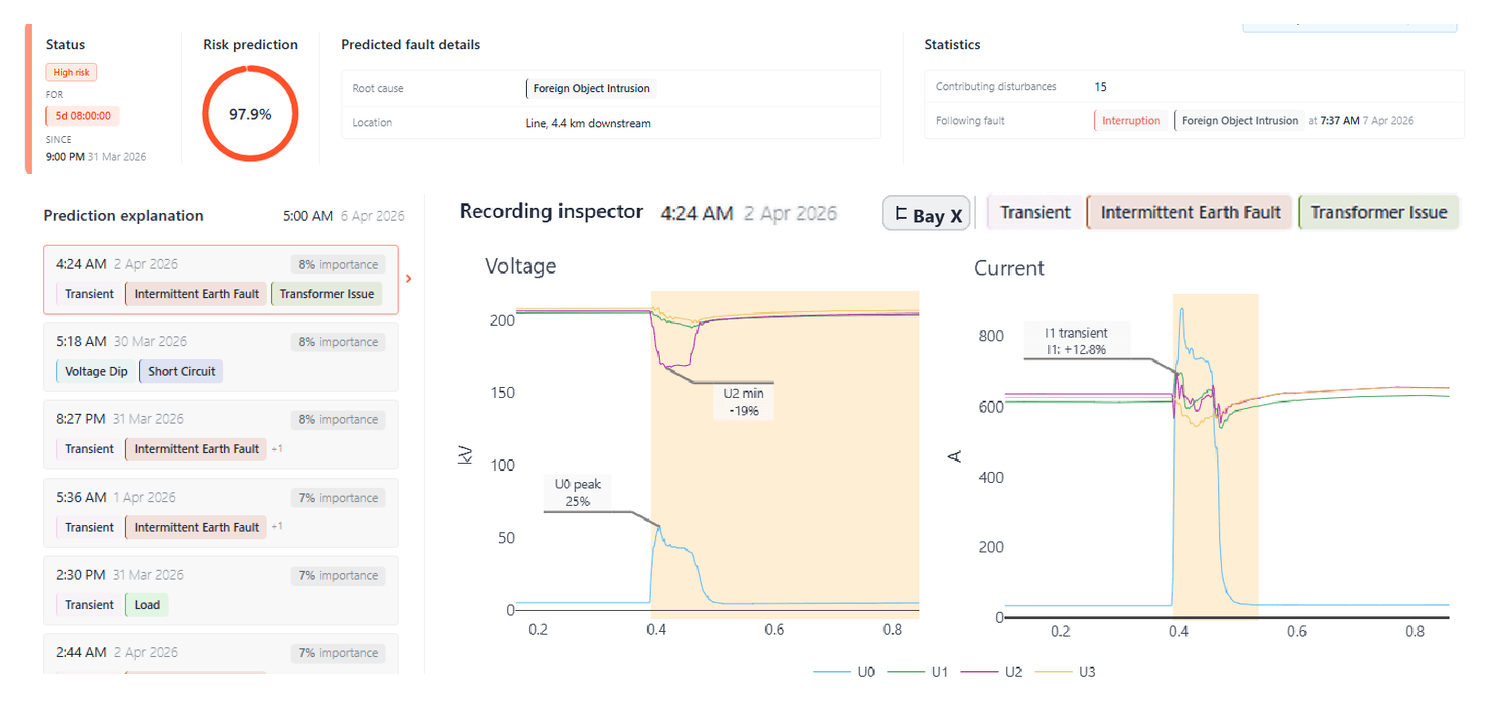
Utilities do not dispatch crews on a number they cannot interrogate. Every warning carries its predicted root cause and likely source; every risk value breaks down into the recordings that produced it, ranked by contribution; and each recording opens in the inspector with events segmented, labelled and quantified. The engineer decides — not the model. Explainability is what turns a prediction into an approved work order.
“A system that can predict problems and identify causes could be invaluable in maintaining the resilience of the transmission system — not only for NYPA but other utilities as well.”
Getting the data
Three ways in — you choose the depth
Eneryield IntelliView® is the analytics layer — no proprietary hardware, built on standard digital-substation measurement. Often nothing new is needed; where digitalization is, we supply it with our partners.
Full digitalization
EcoPhi QMU 800 merging units — up to 2 MHz with virtualised PQ, PMU, DFR and partial discharge — with the IEC 61850-3 CMPC 800 substation server. The deepest view available.
- Hardware: QMU 800 + CMPC 800
- Best when: you want maximum depth
Digital substation
Deployed alongside ABB substation digitalization, with Eneryield IntelliView® running as an application on the ABB CogniEN platform — the route already used at UK Power Networks.
- Hardware: ABB relays / IEDs
- Best when: ABB is already your supplier
Standards-based, any vendor
Standard-compliant digitalized relays, fault recorders and power-quality meters from any vendor — writing COMTRADE records or IEC 61850 sampled values. We read them as they are — no new hardware, first result in weeks.
- Hardware needed: none
- First result: weeks
Whatever the route, the data must provide: three-phase current and voltage (neutral/ground recommended) · event-triggered captures of a few seconds · minimum 1 kHz sampling · COMTRADE or IEC 61850 sampled values.
Deployment, security and access
Deploys where your policy requires
Hosted by us, or entirely inside your environment — one perpetual licence either way. The platform, models and support are identical. Security documentation, penetration-test summaries and licence disclosures are available for your review.
Hosted cloud service
We host, monitor, maintain and update. Users need only a browser — nothing installed locally.
On-premise
Docker and Kubernetes inside your own environment — including fully offline installations with no external connectivity.
Role-based access
Administrator, read-only and custom roles from a defined permission set.
Encryption
TLS in transit; encrypted at rest within the hosted environment.
Tenant isolation
Each organisation's data in its own schema, enforced on every request.
No VPN required
Standard access over HTTPS; private networking provisioned where required.
The first step
Find out in six weeks, on your own data
Send us historical disturbance recordings and your own fault log. We replay the models across that window and report what we would have flagged, when, and why — measured against criteria you set before we start.
Scoped fee
Agreed up front, sized to the data scope.
Nothing installed
No integration, no substation visit.
You set the bar
Success metric agreed before we run.
Six weeks
From receiving the data to the result.
After the replay: a one-time perpetual licence per monitored bay, with service, support and model updates included for the first three years — hosted or on-premise.
Frequently asked questions
What is AI fault prediction?
AI fault prediction in electric power systems uses machine learning on the disturbance recordings substations already produce to detect the early signatures of developing faults — and warn before they cause outages. Eneryield IntelliView® analyzes every recording with physics-informed AI built on 400 expert-designed waveform features, and reports which asset is at risk, the predicted root cause and the likely source — on average 15 days before the fault. Unlike condition monitoring that needs new sensors, it runs on standard relay, fault-recorder and power-quality data (COMTRADE or IEC 61850) — no proprietary hardware.
Do we need to install new sensors or hardware?
Often not — and never anything proprietary. Eneryield IntelliView® is the analytics layer: it runs on standard digital-substation measurement infrastructure — relays, fault recorders and power-quality meters writing COMTRADE records or IEC 61850 sampled values — so in many deployments nothing new is installed at all. Where a substation isn’t digitalized yet, we supply the necessary measurement hardware together with our partners: ABB substation digitalization with Eneryield IntelliView® on the CogniEN platform, or EcoPhi QMU 800 merging units streaming at up to 2 MHz. That enables the analysis — and brings the wider benefits of a digitalized substation with it.
Where does our grid data live?
Wherever your policy requires. Choose the hosted cloud service — we host, monitor, maintain and update, and your users need only a browser — or run Eneryield IntelliView® on-premise with Docker and Kubernetes inside your own environment, including fully offline installations with no external connectivity. Either way: TLS in transit, encryption at rest, role-based access, and each organisation’s data in its own schema. Security documentation and penetration-test summaries are available for review.
Which grid types and voltage levels are supported?
Overhead lines, underground cables and submarine cables, across transmission, distribution and industrial grids. Reference deployments range from 10 kV rural distribution feeders in Northern Europe to transmission cable, reactor and transformer banks in North America, and 33 kV and 69/13.8 kV substation bays in the Middle East.
How do we get started, and how long does it take?
With a six-week replay on your own data. You send historical disturbance recordings and your fault log; we replay the models across that window and report what we would have flagged, when, and why — measured against success criteria you set before we start. The fee is scoped up front, nothing is installed, and the result arrives six weeks after we receive the data. An evidence-based go/no-go before any deployment decision.
How accurate are the predictions?
Measured in live service, not in a lab: 64 faults predicted in advance over five years on a Nordic distribution network, nine on North American transmission assets, and five within months of go-live at a Middle East utility — more than 100 outages predicted in advance across all deployments, with an average warning of 15 days and horizons up to three weeks. And honestly: a lightning strike or a dug-up cable cannot be predicted by anyone. The faults that matter commercially develop slowly — insulation, connectors, earth contact — and those are the ones we catch. The replay measures accuracy on your grid, against your own fault history, before you commit.
What does "explainable AI" actually mean here?
Every warning carries its predicted root cause (insulation degradation, foreign object intrusion, evolving earth faults and more), the likely source, and the time horizon. Behind each risk value sits the list of recordings that produced it, ranked by contribution — and each recording opens in the inspector with RMS traces, harmonic spectrum and impedance, events segmented and labelled. The analysis runs on 400 expert-designed waveform features grounded in electrical physics. The engineer decides — not the model.
Does Eneryield IntelliView® integrate with our existing systems?
Yes. On the input side it reads COMTRADE records and IEC 61850 sampled values from your relays, fault recorders and power-quality meters — and it runs as an application on the ABB CogniEN platform where ABB is your digitalization supplier. On the output side, risk values and alarms are available over a REST API to feed your SCADA/ADMS, historian or work-order system, alongside scheduled reports and threshold alarms by email.
What does it cost?
A one-time perpetual licence per monitored bay, with service, support and model updates included for the first three years — hosted or on-premise. Deployment starts with a six-week replay on your historical data, scoped and priced before any installation — so the business case is built on your own numbers before you commit to anything. Contact us for a quote for your network.
See Eneryield IntelliView® on real grid data
In 30 minutes, our founders will walk you through live fault prediction on reference data — and scope a six-week replay on yours.